How to correctly calculate meaningful average fuel consumption.
There are 3 ways to calculate the average consumption from groups of individual fuel consumption values. The calculation of the average value, the total consumption and the weighted average value.
You should always calculate the average consumption from many individual values before making a judgment.
In my articles in the fleet management category, I repeatedly pointed out that no conclusions should be drawn from an individual consumption value determined during normal driving. It is too volatile.
Now, in this article, I will show you how to correctly calculate the average consumption and how to assess whether the value is good enough to be used.
You will find three ways of calculating and learn the pros and cons of each alternative.
Finally, we discuss how the quality of the average consumption value can be assessed by calculating a key figure.
The article will help you to choose which of the three options is most suitable for you.
You will be prepared to start improving your fuel consumption in a targeted and systematic manner.
Don’t let the formulas scare you, it’s easy to calculate. I will explain it very simply in the text.
What is average consumption?
On some other websites, you will find what I call the “single value” under the term “average consumption”.
This is not a wrong statement.
The consumption over the route from one refueling stop to the next is made up of a number of averaged, unknown 100 kilometer values.
But, if I use the name “average consumption” for this number, how do I call then the average of the averages that we need for fleet monitoring?
For the sake of clarity, let’s agree:
This allows us to distinguish the two different values with their strengths and weaknesses.
The fleet monitoring method uses the average consumption value for assessing the fuel consumption. It averages out the random consumption distortions because it covers not only several hundred, but several thousand kilometers driven.
You can read how to do fleet monitoring in the article How To Find Out The Fuel Consumption Using Fleet Monitoring.
The average consumption is the figure, which you need to compare and improve.
It can be calculated for individual vehicles, for the entire vehicle fleet, or for a selected group of vehicles sharing some common features. It depends on what you want to look at.
Systematic influencing factors serve as characteristics. I am going to explain in detail how to do this search for improvement measures in a separate article.
Let’s look now at the different ways how the average fuel consumption value can be calculated.
1. Alternative—The mean of the single consumption.
The most obvious and therefore probably the most frequently used formula is the mean value.
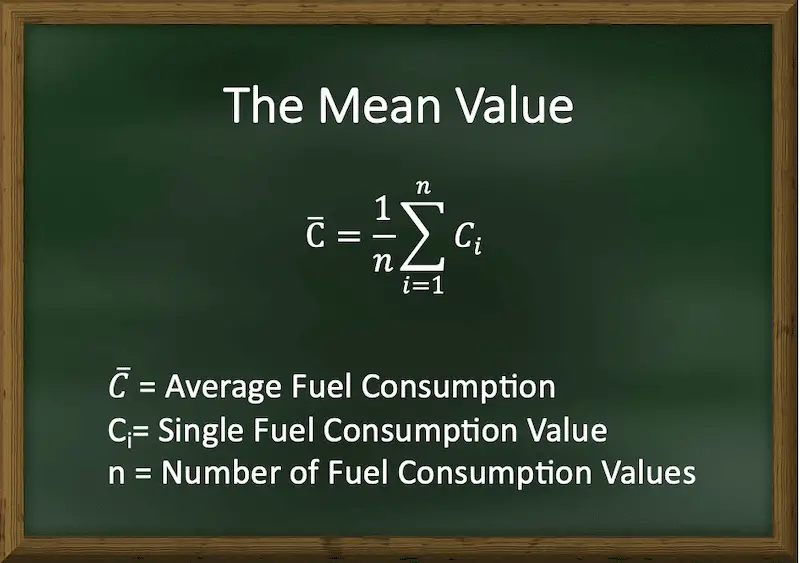
All individual consumption values are added up and divided by the number of values.
Microsoft Excel has its own mean formula that you can use.
=AVERAGE(A1:A10)
Column A of the Excel spreadsheet contains the individual consumption values.
Using the mean formula, we lose the correlation to the distance!
However, this calculation method has a considerable potential for error. Therefore, I recommend using this procedure only if you control the error closely!
By calculating the average consumption as the mean value from the individual consumption, you lose the relationship between fuel consumption and distance.
Each individual consumption value is taken equally seriously.
That’s bad because it means that the frequency of refueling has an impact on the result of the average consumption calculation, and that’s not correct.
The following happens:
This error occurs whenever the severity of the operation or the load changes significantly during operation.
I want to show that with an example.
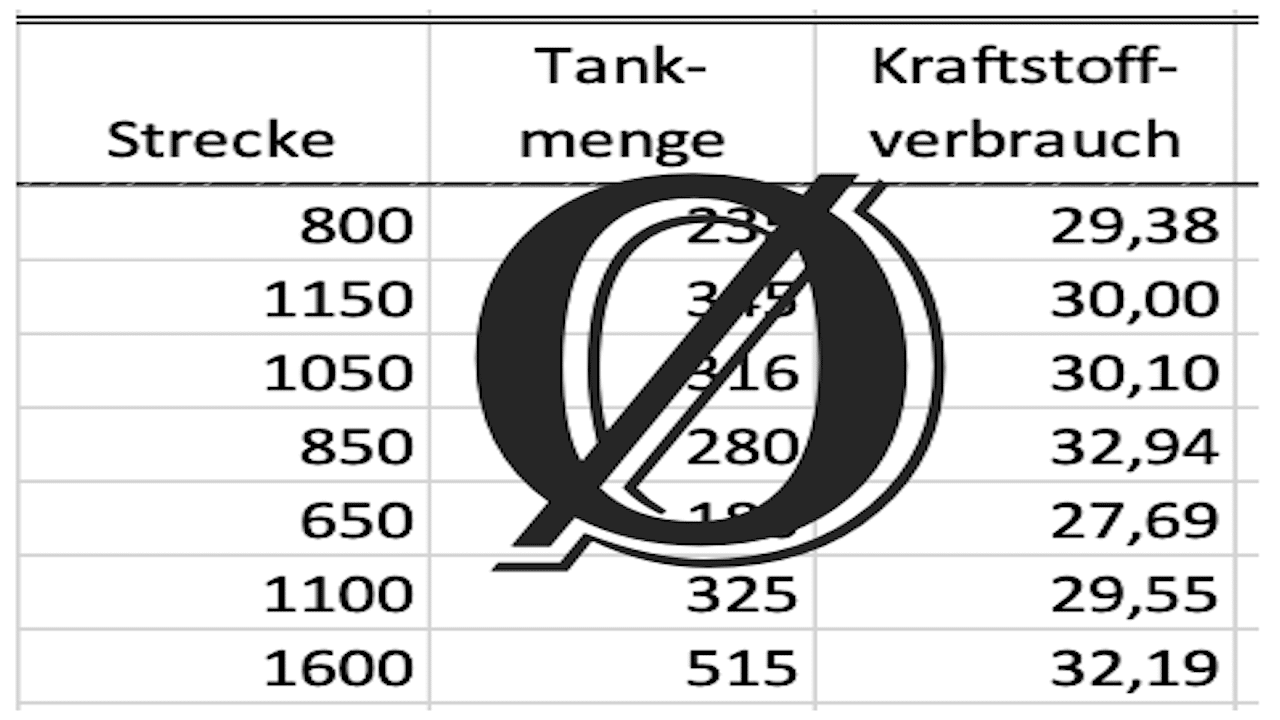
I chose some values arbitrarily so that this effect becomes clear. I am going to use the same values for all sample calculations. Then we can compare the results at the end.
| Refueling | Odometer reading (km) | Distance (km) | Diesel Volume (l) | Fuel Consumption (l/100km) |
| 1 | 300 | 300 | 90 | 30,0 |
| 2 | 800 | 500 | 140 | 28,0 |
| 3 | 1400 | 600 | 210 | 35,0 |
| 4 | 1700 | 300 | 100 | 33,33 |
| 5 | 2500 | 800 | 219 | 26,25 |
The calculation of the mean value looks like this:
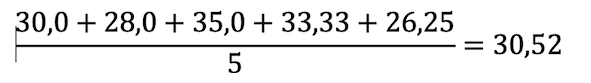
Remember this value, we will compare it with the results of the other calculation options below.
Is the accuracy acceptable?
Since this calculation method is very simple, you will surely wonder whether the error is acceptable.
Well, the first thing you should do, is assess how big the error really is in your specific case.
Therefore, you should use the other calculation methods for comparison.
If the deviation between the results of the different ways of calculating is small in your typical use cases, you can go on with the mean value formula.
Calculating the scatter gives you another clue. I’m going to show you how to do it later in the article. If the scatter of the individual values is low, then the error is also small.
Another alternative is to do the refueling based on the time instead of the fill level.
If you always fill up at the same time, regardless of the fill level in the tank, then this error is reduced as well. The refueling could be done at the beginning or the end of each day or shift.
However, with time-based refueling, you risk an error due to the mixing temperature. But that could be the better alternative because the errors are evened out over the refueling events if you don’t skip any.
2. Alternative—The total consumption.
A simple alternative that avoids the error of the mean value is the calculation of the average consumption as the total consumption.
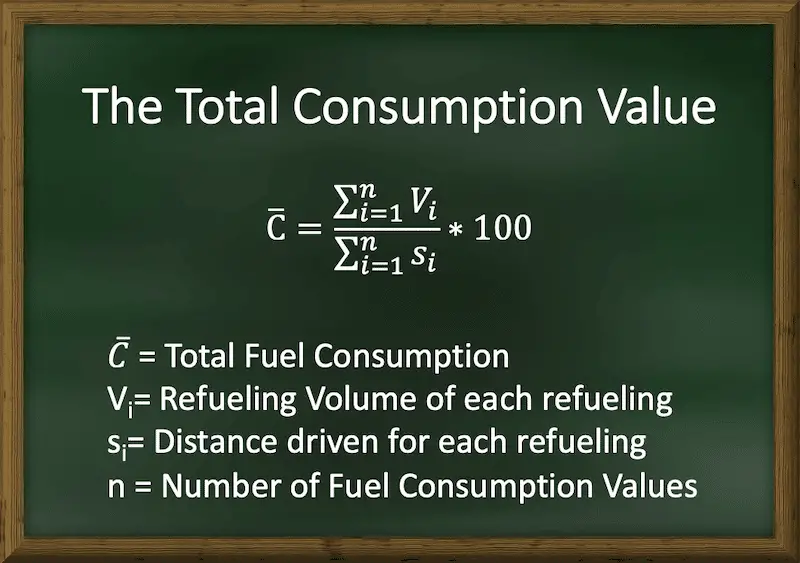
For the total consumption, the tank quantities and the distances driven are added up individually. Then the sum of the diesel volumes is divided by the sum of the distances traveled and multiplied by 100.
Calculation of the total consumption
Although there is no predefined formula for this calculation in Excel, it is very easy to write down manually:
=100*SUM(A1:A10)/SUM(B1:B10)
Column A contains the tank quantities and column B the distances traveled.
Here is the example of the total consumption calculation with the input values from above:
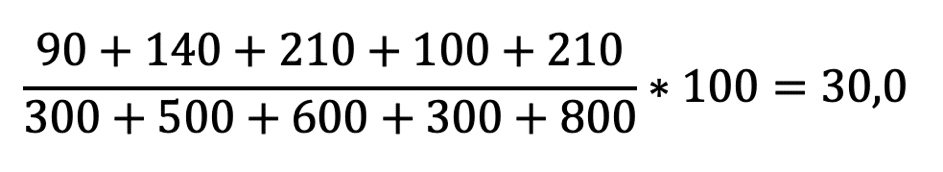
In my example, this results in the correct average consumption of 30.0 l/100 km.
The error of the mean calculation is 1.7% (30.52 l/100 km vs. 30.0 l/100 km).
A drastic mistake! And that, although the individual consumption values are not sooooo far apart.
So you see it’s important to look at this closely.
I recommend using the calculation of the total consumption, since all data are usually available and the time-consuming weighting of the mean values can be avoided.
3. Alternative—The weighted mean of the single consumption.
Let’s now look at the calculation of the weighted average.
This formula gives each individual input value its correct share of the overall result.
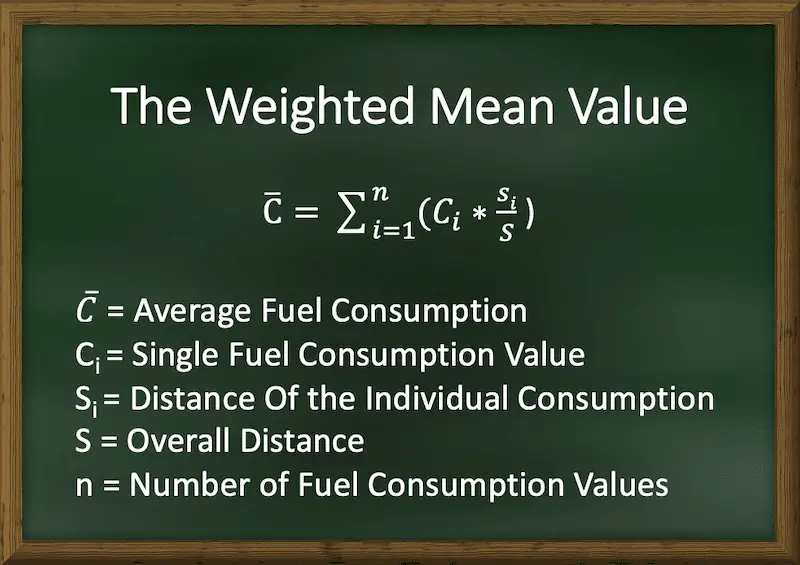
The weighted average is calculated by calculating the share of the total consumption for each individual consumption value. To do this, the associated distance is divided by the total distance traveled and then multiplied by the fuel consumption value. The average is then the sum of all products from individual consumption and the associated route factor.
Calculation of the weighted average
For calculation of the weighted average in Microsoft Excel, you can use the sum-product formula.
=SUMPRODUCT(A1:A10, B1:B10)
Column A of the Excel table contains the individual consumption values. In column B, you need to calculate the weight for each individual value. This is the corresponding distance divided by the total distance.
Using my example data, the manual calculation looks like this:
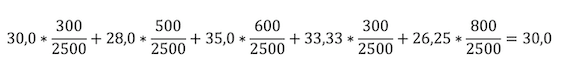
As you can see, the result here is the same as when calculating the total consumption. So this method is also accurate.
Calculating the total consumption is more workable in my opinion, so I would prefer it.
At the moment, I can’t think of a situation where I would use the weighted mean method. Possibly if only the consumption data from the vehicle and the mileage are available and not the amount of diesel.
The standard deviation – is an indicator of trustworthiness.
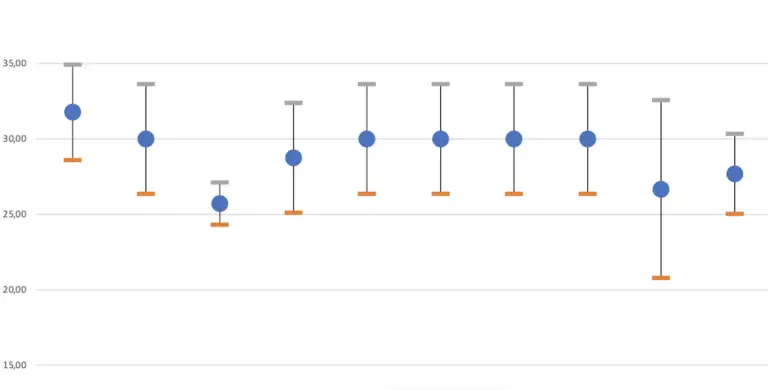
Last but not least, we now want to check how much the individual consumption values scatter around the average consumption.
It is logical. The closer the single values are to each other, the more likely the average value is really representative.
If the individual values differ widely, there is a risk that the average consumption contains a larger error and is therefore not representative.
In the article: “How to assess the distribution of fuel consumption values?” I describe exactly how you can calculate the scatter of consumption values and how you can use it to check the accuracy of the average consumption.
So please make sure to check them out!
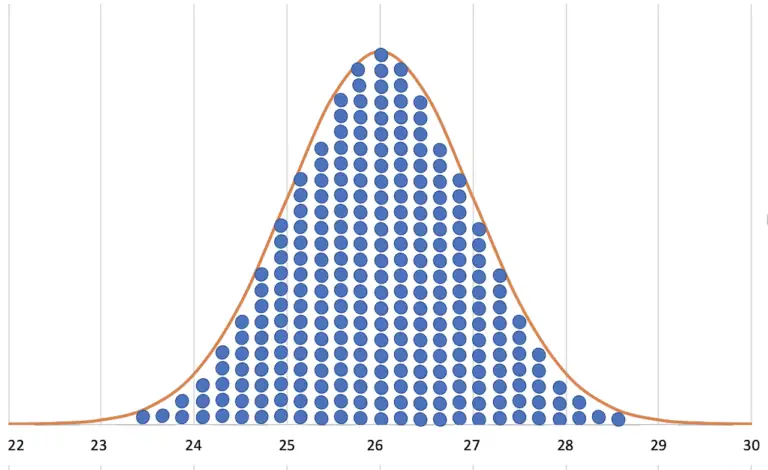
In the article: “The Normal Distribution—How Chance Can Be Calculated.”, you’ll learn the theoretical basics of why it all works the way it does.
Also, the article: “Why fuel consumption scatters. (simply explained)”, is worth reading in this context.
Summary
In the next article, I will explain which statistical approaches you can use to further narrow down the uncertainties and when and how more data can help.
So please read it, it brings an even better understanding of the problem.