Why does fuel consumption vary? (a simple explanation)
The fuel consumption of a vehicle varies because the driving resistance and the efficiency of the vehicle are constantly changing. This is unavoidable in real use.
The spread of fuel consumption is really annoying. It makes everything complicated and confusing.
You want to know the fuel efficiency of the vehicle, but every time you calculate the fuel consumption, something different comes up.
The scattering is particularly disturbing when checking the effect of consumption improvement measures.
Sometimes the values go up, sometimes they go down. How are you going to come to a conclusion?
To make matters worse, the effect of consumption-improving measures is often even smaller than the spread of the values.
You see the values changing, but you don’t know whether the measure is really the root cause of the change. Possibly it’s just the spread.
In this article, I will not only explain why fuel consumption varies, but also how it varies.
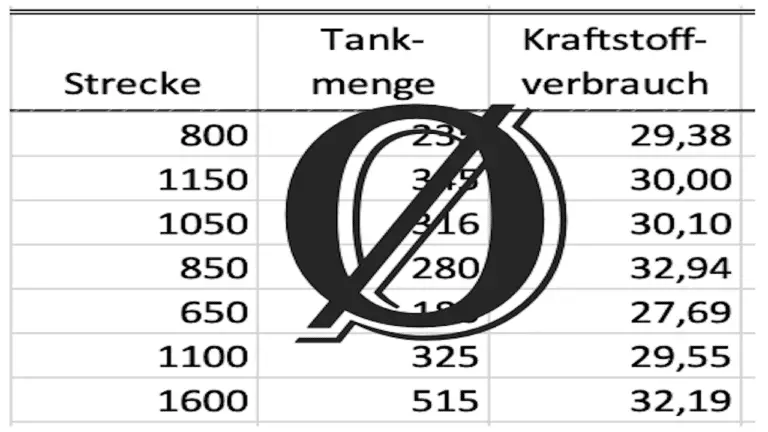
What does it depend on how much diesel is taken from the tank?
The amount of diesel consumed corresponds exactly to the amount of energy needed for the driving resistance work, plus the waste heat that is produced during energy conversion.
This matter deserves its own article. I still need to translate this other blog post, please sign up here. I will notify you when it is ready.
Basically, the driving resistance determines how much diesel is sucked out of the tank.
However, the ratio between driving resistance and diesel energy is not 1:1. In the ideal case, it is in the range of more than 1:2 for vehicles with a diesel engine. In reality, the ratio is even worse.
The reason is the energy conversion loss, which produces a proportion of waste heat for each unit of driving resistance work.
Unfortunately, this also means that the scattering of the driving resistances is increased by the corresponding factor when translated into diesel consumption.
Energy inflow and energy outflow are always in balance.
Please imagine a pair of scales in balance.
On one side of the scale, we have the energy poured into the vehicle. This is the chemical energy (diesel) that is taken from the tank by the engine.
On the other side of the scale is the energy that flows out of the vehicle. It is the waste heat (red) and the driving resistance work for driving (blue).
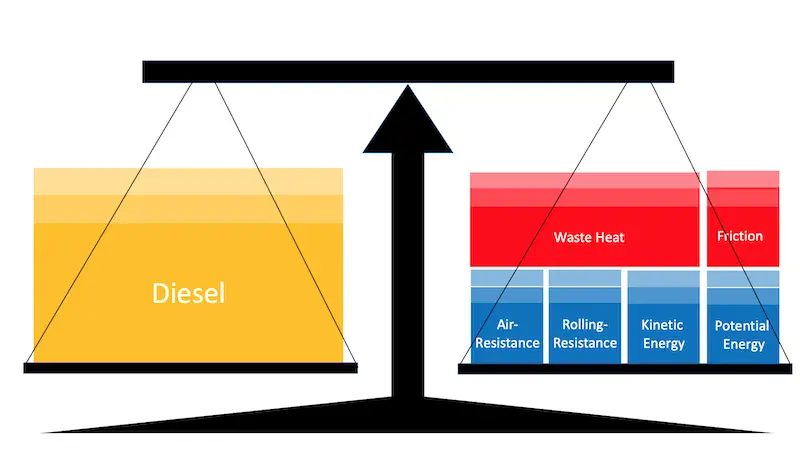
The spread of driving resistance and efficiency determine the spread of fuel consumption.
In order for the scale to remain in balance, both sides must be exactly the same amount. Therefore, the variation on the left is the same as on the right.
The diesel consumption spreads exactly to the same extent as the waste heat and the driving resistance (work) spread. Their scatter is the actual cause of the scatter in fuel consumption.
So, if we want to understand the reasons for the spread in fuel consumption, we need to look at the reasons for the spread in driving resistance and efficiency.
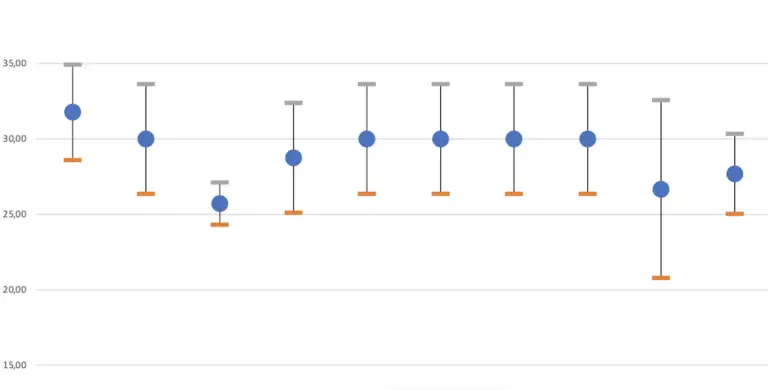
Each consumption factor has three components that scatter to different extents.
Each block on the scale consists of three parts that fluctuate to different degrees.
I have represented this in my scale – picture using different dark colors.
I’ll go into each block in a moment.
The amount of energy on the right side of the scale is constantly changing, especially the light part is sometimes larger and sometimes smaller. As a result, the amount of diesel on the left side also changes.
The absolute minimum has no spread.
Here I am now talking about the dark parts.
The fuel consumption includes the minimum energy requirement, which is determined by the basic technical concept of the vehicle and the basic operating conditions.
This part of the consumption cannot be undercut without fundamentally changing the vehicle concept. For example, using a horse-drawn carriage instead of a diesel truck.
As long as you stay within the given concept, this part of the consumption is the fixed limit. We can’t get there, no chance.
A truck will never use as little energy as a bicycle. Not even when it’s empty and only carrying the driver. That’s not what it’s made for.
- As long as a truck has a certain high and width and moves on the surface of the earth, it will always experience drag, no matter how streamlined it is built.
- As long as a truck with pneumatic tires rolls on a road, it will never achieve the rolling resistance of a train wheel on an iron rail.
- As long as an internal combustion engine generates the driving force, the efficiency of the ideal combustion process cannot be surpassed.
- As long as the driving force in the vehicle is transmitted through shafts and gears, frictional heat is unavoidable.
This is logical and corresponds to our experience.
The share of minimum energy consumption has no scatter. However, it is not easy to set it apart from the rest.
The vehicle manufacturers are exceptionally unanimous:
The CO2 limits of the European Union for the year 2030 can only be achieved through the use of alternative drives.
The reason lies precisely in this proportion of the minimum fuel consumption.
A fuel consumption reduction of 30% based on the fleet average of 2019/20 pushes the fuel consumption figure beyond the physical minimum of diesel trucks.
The only way out is to fundamentally change the physical principle.
The task cannot be solved by optimizing the diesel drive alone.
By the way, e-trucks also have this share of energy consumption, even if it is significantly lower than with combustion engines. That’s why electric trucks will always need significantly larger batteries than e-bikes.
Changes in operation and on the vehicle can affect the fuel consumption value.
This is now about the middle part of the blocks.
The fuel consumption includes a proportion that can be changed without changing the basic technical concept or the basic operating conditions.
This proportion of fuel consumption tells us how good the vehicle/driver system is and indicates the room for improvement.
This part is very interesting for optimizing fuel consumption.
We implement a change and the energy consumption changes by a constant amount. I call this proportion “systematic” because it behaves in a predictable manner.
It’s not really a bad thing that it’s difficult for us to separate this proportion of consumption from minimum consumption.
Since we cannot change the minimum consumption anyway, and it has no variance, we can attribute every change to systematic factors. We do need to get rid of the random factors, though, but more on that in a moment.
To illustrate such systematic factors, here are some examples:
- The use of aero fairings reduces the vehicle’s drag coefficient and therefore the amount of fuel required to overcome drag. This change is reproducible. You can measure the effect in a wind tunnel, for example.
- If you fit tires with a consumption-optimized profile, the rolling resistance decreases and less diesel is used as a result.
- An engine with better combustion due to an optimized injection system has a higher engine efficiency. You can measure this on an engine test bench.
- A friction-optimizing oil sustainably improves the efficiency of the transmission.
We’re looking for these things. We want to find such measures, implement them and check how they affect fuel consumption.
I will write many, many more articles in my blog that will deal with exactly these possibilities of improving consumption. So here are just a few examples. They should help you to better understand the proportion of fuel consumption. The list is far from complete.
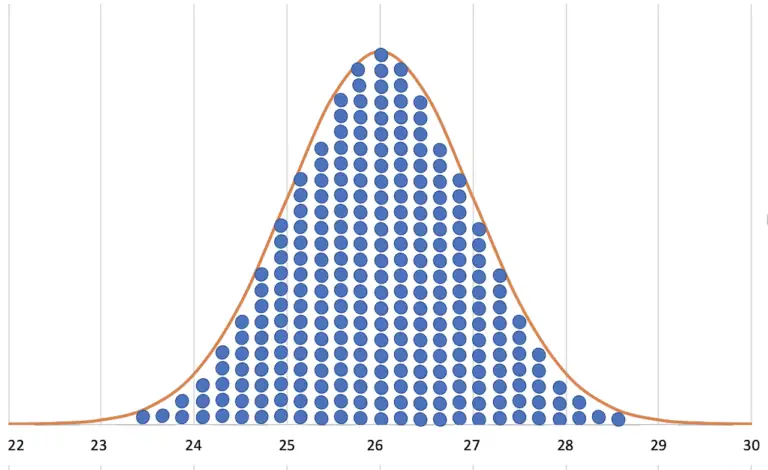
The systematic factors that can be influenced, do not have any scatter themselves. But they shift the complete distribution of the fuel consumption values. However, they also can influence the effect of the random factors and thus the scatter.
Changing these factors results in a change in the average consumption value.
Because the systematic factors impact all individual fuel consumption values with the same tendency, they shift the mean value of the consumption values.
You can find more information about this in the article that explains the normal distribution.
Systematic consumption factors also change unnoticed.
The tricky thing about these factors is that they sometimes change unnoticed.
Then it can happen that we misinterpret the resulting change in consumption.
If such changes occur gradually or only affect a part of the consumption values, it can appear as an increased spread.
In the worst case, they falsify the result without showing up in a conspicuous scattering. These factors themselves do not scatter, so they can shift the consumption value without changing the scatter.
I then call this a systematic error, which can lead to wrong conclusions.
Imagine installing an aero spoiler and expecting an improvement in fuel consumption when you measure fuel consumption.
Unfortunately, the sliding caliper of the wheel brake is jammed right now and does not reset itself properly. This creates increased friction in the brake.
This has nothing to do with the aero spoiler!
You would then see a deterioration in consumption instead of an improvement in consumption due to the spoiler.
Only by examining the vehicle closely, you would find out that a positive and a negative systematic influencing factor have overlapped here.
If the jamming does not occur at the same time, but later than the installation of the spoiler, you would see an increased spread of your consumption values.
So we have to be very precise and attentive when working with the systematic consumption factors.
The spread of fuel consumption is caused by random factors.
Now we are at the real focus of this article, the light portion of the blocks.
Fuel consumption includes a proportion that changes constantly without any conscious influence. The causes are volatile influences from the environment of the vehicle.
It’s impossible to predict exactly what the temperature and wind will be at the moment you arrive at a certain point on the road.
If you look at the weather forecast, you can find out approximately what the weather will be like. The exact situation is left to chance.
It is completely impossible to influence the weather. You are not able to adjust temperature, wind strength, or direction consciously at any exactly given time, at any exactly given place!
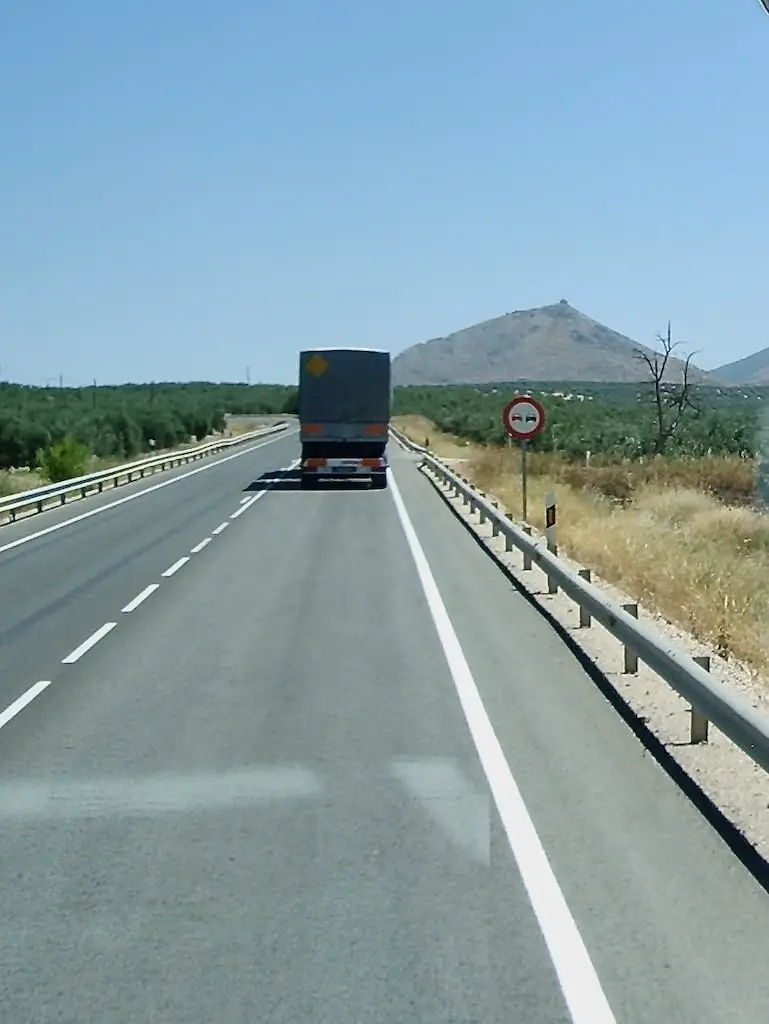
Why is there another truck with a higher GCW or lower power in front of you on this incline right now, forcing you to drive at a speed that you don’t actually want to drive?
This was not foreseeable but happened unintentionally and unexpectedly.
Well, on certain highways it is predictable by now, the speed is still random.
You couldn’t predict it exactly, nor can you do anything about it. After all, as usual, it’s no overtaking.
Why is the topography exactly the way it is?
Why didn’t the road construction company make the road dead level and dead straight?
There are surely good reasons for this.
It is very rare that you have the opportunity to influence the course of the road and have it made according to your wishes.

The scatter of the fuel consumption value is caused by random factors.
Factors that influence the level of driving resistance and efficiency are constantly changing while driving. This is unavoidable.
Since this volatile effect of the factors is ultimately responsible for the spread of fuel consumption, I would like to list a few here.
Random influencing factors on drag.
- Wind direction
- wind force
- Air temperature (air density)
- Air pressure
Random influencing factors on rolling resistance.
- Road surface/temperature
- Temperature / solar radiation
- Wheel load distribution
- Tire temperature
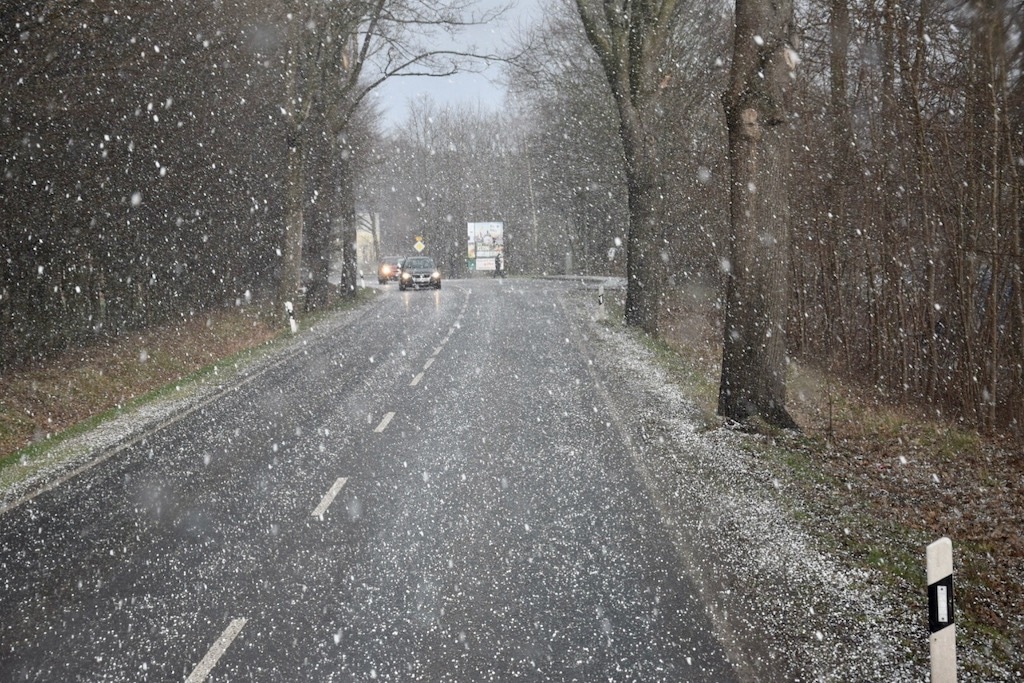
- Rain/snow
- Drive torque
- Side wind
- Road bends
- Driving speed
Random influencing factors on slope resistance.
- Slope gradients
- Roll phase progressions
Random influencing factors on acceleration resistance.
- Traffic-related accelerations
- Roll phase progressions
Zufällige Einflussfaktoren auf den Motorwirkungsgrad.
- Timeshares in the different operating points in the engine map.
- Outside temperature
- Ambient air pressure
- Diesel temperature
- Vibration in the intake and exhaust ducts
Random influencing factors on friction.
- Force
- Oil temperature
- Temperature and force-related changes in bearing fits and clearances
This list is far from complete. If you have any additions, please let me know in the comments.
I will come back to these topics again and again in many further articles and explain them in more detail.
The effect of these influencing factors is predictable, but their occurrence is not.
Every single impact of these factors on fuel consumption is reproducible.
However, the timing and extent of the occurrence of these factors is unpredictable.
In retrospect, it is also difficult to reconstruct when which factor was present.
The occurrence of these factors is random. This has consequences:
Systematic influences must be separated from random influences in order to assess fuel consumption.
For separating the disturbing part of the scatter in the fuel consumption value, there are three possibilities. Each of the possibilities requires its own consumption measurement method.
The first option cannot be implemented in everyday use. It would distract you too much from the actual business.
The third option requires complex computer models and expensive test benches.
For the second option, you need to assess whether you have enough data to eliminate randomness. So, please take a look at how randomness works.
Summary
If you want to apply what you have learned, you should read the following articles:
In the article: “How to correctly calculate meaningful average fuel consumption.” you will find out how to combine the varying fuel consumption values into a meaningful mean value that you can then work with.
Then you still have to check whether the mean value is really representative of the entirety of the values.
The explanation of the normal distribution helps you to better understand the scatter itself and in “How to control the scatter of consumption values” you ultimately learn to judge the quality of the mean value.