How To Find Out The Fuel Consumption Using Fleet Monitoring
The fleet monitoring method works for cars and trucks.
I will explain it here using the example of trucks, but you can also use the same procedure for cars.
You have probably already calculated the fuel consumption of your vehicle yourself.
If so, then you have already taken the first step toward “fleet monitoring”. And if not, you can learn it here.
But a single, randomly selected fuel consumption value won’t help you much, because you can’t answer the following important questions:
- Can you trust this value?
- Is it meaningful and representative?
- Is it error-free?
- Is it good or bad compared to other values?
Each time you repeat the exercise, you will find different numbers. Which one do you use? That is not clear.
Simply calculating a fuel consumption value is not enough!
You need reliable, trustworthy, and meaningful information.
The fleet monitoring method provides you with the required quality of fuel consumption information.
In this and the following articles, I will explain exactly how fleet monitoring is done correctly.
In the end, you will be able to answer the central questions of all consumption investigations because we get to the bottom of the uncertainties.
The article “4 Ways To Determine The Correct Fuel Consumption” gives you an overview of all methods of determining consumption. Reading it will help you put fleet monitoring in context with the other, alternative methods.
What is fleet monitoring?
Fleet monitoring is a method that determines the condition of a vehicle or a fleet of vehicles by collecting data while driving in real operation.
You may be wondering:
What is the difference between Fleet Management and Fleet Monitoring?
Here is the answer:
Fleet management describes the management, planning, control, and monitoring of fleets. This involves coordinating, evaluating, and optimizing the routes of vehicles (trucks, cars, ships, trains, buses), taking into account certain influencing parameters. Fleet management helps to make the best possible use of all resources and services and to identify, rectify, or avoid problems at an early stage. (Source: Flottenmanagement – Wikipedia)
Fleet Management looks at the business as a whole. It covers all aspects of managing a fleet of vehicles.
An important task of fleet management is to plan, optimize, and monitor the use of vehicles to ensure smooth and efficient operation.
This is why operational processes such as scheduling or order management play a major role. One particular aspect is the live monitoring of the vehicle’s position using GPS.
You find a very detailed description of all the different functions which can be included in Fleet Management on this website: Wikipedia: fleet management.
One example is predictive maintenance, which helps to avoid unplanned downtimes.
In this article, I will focus exclusively on fuel consumption as a sub-area of fleet monitoring
The challenges of determining consumption.
Whenever we deal with fuel consumption, we have to consider the following:
Fleet Monitoring uses a special approach, that I will explain to you in detail. In the end, you know exactly what to look out for.
However, I will not go into the measurement errors in depth; they are dealt with in the same way as the systematic and random environmental factors.
There are separate blog articles on all three topics that go into them in detail. I can therefore leave it at a brief overview below in this article.
Please take a look at the other articles anyway, you can find them all in the category “Determining consumption” on my website. (Measurement errors, random environmental factors)
Fleet management IT tools typically also include fleet monitoring.
There is a whole range of software providers on the market that offer IT systems for fleet management.
These systems provide quick access to the data and advanced functionality, that makes the work easier.
Fleet management software products are offered by vehicle OEMs as well as from suppliers specializing just in this field.
Even some component suppliers, like tire companies, are active in this field.
The solutions offered by vehicle OEMs focus typically more on the fleet monitoring aspects of fleet management.
There is a good reason for that.
Vehicle manufacturers have a self-interest in optimizing the fuel consumption of their customers’ vehicles by utilizing fleet monitoring.
Providing good advice to customers is oftentimes a much easier task, and more profitable, compared to squeezing out the last fraction of technical efficiency.
Fleet monitoring can provide this valuable advice.
For you, it should be welcome.
You can use every piece of advice, as long as the fee is less than the saving it realizes.
In this article, I will explain how to do fleet monitoring manually.
You don’t have to buy fleet management software to do fleet monitoring
Understanding the manual approach also helps you to evaluate IT solutions to see whether they meet your requirements.
How to find out the fuel consumption with fleet monitoring?
Fleet Monitoring uses a large number of fuel consumption values from the real driving of the vehicles to calculate an average fuel consumption.
This average value is representative of the conditions under which the fleet is operated.
The possible sources of error are identified and taken into account so that the right conclusions can be drawn.
The basic principle of fleet monitoring is to analyze the data from the past and derive conclusions for the future from it.
It takes a certain amount of time to collect the data, so you need patience.
As a reward, the predictions for the future are realistic.
Procedure for fleet monitoring
Here is a checklist of the steps you have to take if you do fleet monitoring manually:
Let’s look at the steps in detail now.
Determine the individual consumption values.
Fleet monitoring is based on real consumption values from daily use. Unlike all other methods, no special measurements are carried out.
The input values for the calculation of the fuel consumption are the distance traveled and the volume of fuel consumed.
They can be recorded in different ways.
You should calculate a fuel consumption value for each refueling.
I recommend doing this without interruption.
Leaving gaps in the records can lead to inaccuracies.
The calculation of the individual consumption value is simple:
Divide the diesel volume filled by the distance traveled since the last fuel stop, and then multiply by 100. This gives the fuel consumption in liters per 100 km.
In the article 4 Ways To Calculate Fuel Consumption (incl. calculator) I explain this in detail.
Please refer to the chapter: “The Relative Fuel Consumption in liter per 100 km.” I strongly recommend reading this article.
There you find also the formula for the people who prefer using miles per gallon instead of l/100 km.
There is also an online calculator.
That’s a pity, because it’s so easy to calculate. But don’t worry, it’s not difficult to calculate the average consumption either.
Calculate the average consumption.
In fleet monitoring, the individual fuel consumption values from vehicle operation are used as the starting values for calculating the average value.
The average consumption is therefore the actual representative final result.
It sounds complicated, but it’s not! I promise that you can calculate your values without any problems.
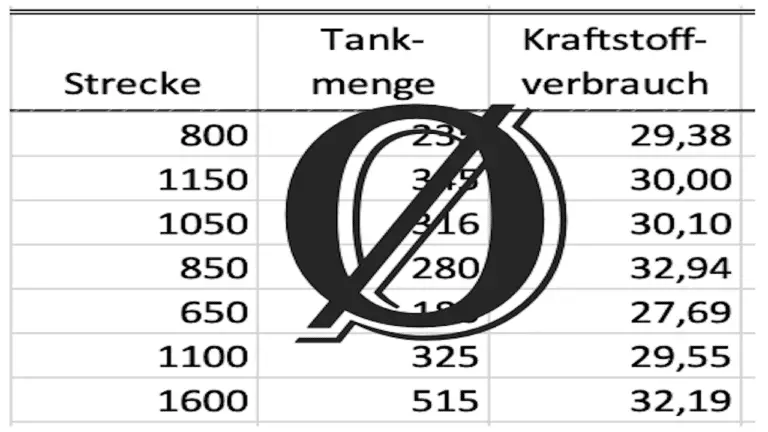
Add up the individual consumption values and divide the sum by the number of values.
But wait! There are still some considerations, that you need to take into account before you can trust the result.
This matter also deserves a dedicated article. Here you can read how to calculate a trustworthy average fuel consumption value. It tells you which mistakes you should avoid.
Perform fleet monitoring using an Excel spreadsheet.
Write me an email, and you can receive an Excel spreadsheet that assists in calculating fuel consumption with fleet monitoring.
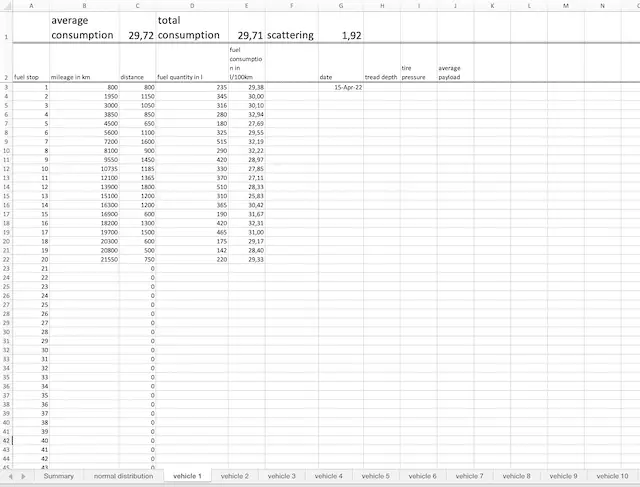
In the table, you will find tabs where you can calculate individual consumption values. Here, you can also note additional information that will assist you in the analysis later.
You need to decide which groups you want to capture in each spreadsheet. In my example, they are different vehicles, but they could also be different drivers.
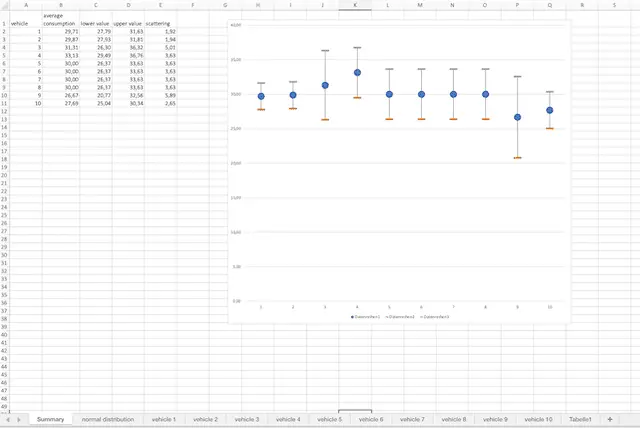
So, enter the odometer reading and fuel volume, and the table will calculate the individual consumption value. Simultaneously, it will also calculate the average consumption, its dispersion, and the range around the average consumption where the true consumption is likely to be with 95% probability.
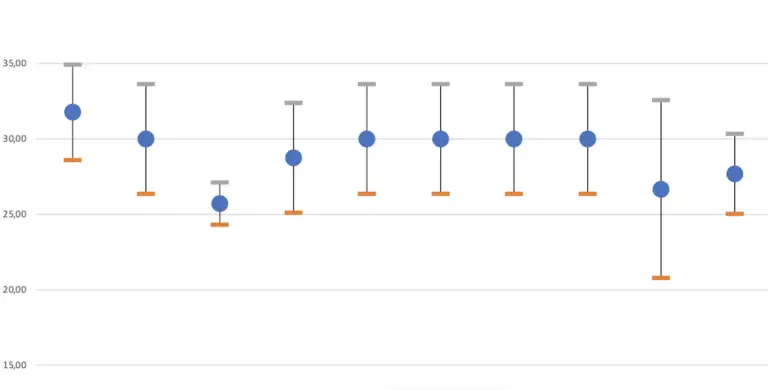
Since you have only a limited number of fuel consumption values, the result is never absolutely precise. The confidence interval indicates the range around the calculated average consumption within which the true consumption is likely to be with 95% probability.
The smaller the interval, the more reliable the average consumption.
On the summary sheet, you can see the average consumption of all groups in comparison. The confidence intervals is indicated by lower and upper consumption values.
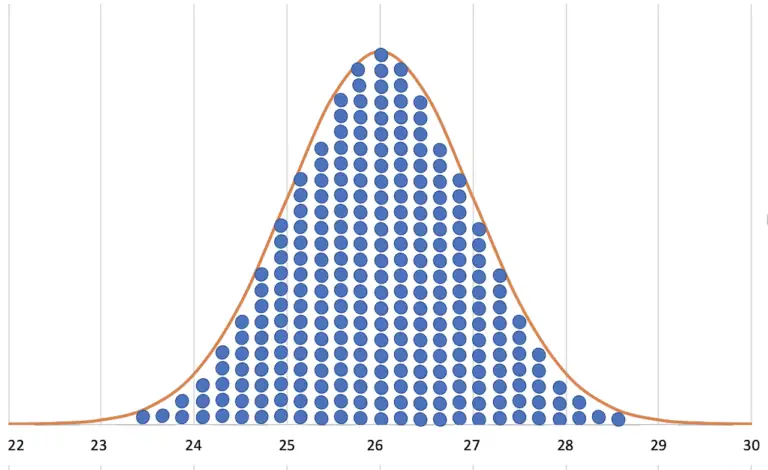
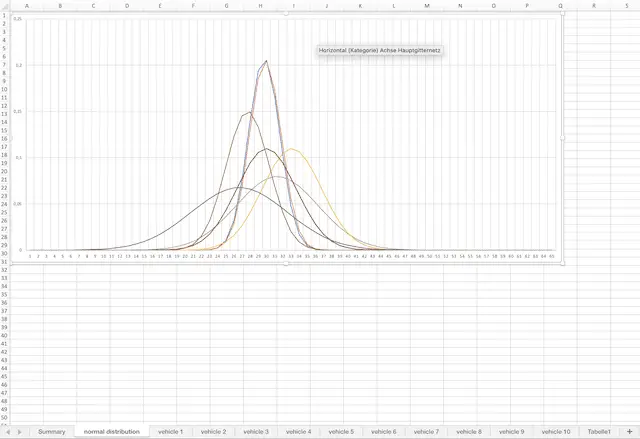
In the second tab, you will find the representation of the corresponding normal functions. These graphs are helpful during evaluating the data.
Now you have a result.
You would like to have the file? Fill out the form, and push send. I will e-mail you the file at no cost.
Next, let’s dive into the world of influencing factors.
How does fleet monitoring help you save fuel?
In order to optimize fuel consumption, it must be continuously monitored.
So, we’re doing that with fleet monitoring.
Fleet monitoring not only provides data on fuel consumption but also trends and contextual information.
You can use the additional columns in the Excel File, for entering such data.
By using all of this data, you can then assess positive and negative changes and identify the impact of influencing factors. Focus on factors that are within your control.
When you do this, you can use this information to recognize changes for the better or worse.
However, you must also filter out the factors that cannot be influenced; otherwise, they will obstruct your view of the essential aspects.
You will learn how fleet management tackles this task in this article.
Random factors are not included in the table; fleet monitoring handles this automatically when you have enough individual values.
This is crucial because if the consumption value is not representative, incorrect conclusions may be drawn, potentially leading to wrong decisions.
We definitely want to avoid that trap.
How does fleet monitoring deal with the influencing factors?
During operation, numerous influencing factors affect fuel consumption and thereby change its value.
This is the reason why a different result comes out every time you do this calculation. The difference between the values is called scattering.
In order for the fuel consumption to be meaningful, these influencing factors must be taken into account.
I group the influencing factors into two categories.
We need to neutralize the random factors so that we can focus on the systematic factors.
What are random influence factors?

Random influencing factors change the fuel consumption, but cannot be influenced consciously. They depend purely on chance.
Since you cannot influence these factors, they are of no interest for fuel consumption improvement.
Their influence on fuel consumption is disturbing.
They are one of the reasons why consumption values always vary. Therefore, we need to eliminate the influence of these factors.
However, it is important to know and name them.
Here is a list of the main random factors:
- Ambient temperature
- Wind force
- Wind direction
- Rain
- Road condition
- Road curves
- Driver concentration
- Traffic density
- Traffic jam
- Speed limits
- Construction sites
- Slopes
Think if you know any more and write them to me in the comments.
For the classification into random and systematic influences, you have to answer whether you really have no influence on the factor in question.
Factors that can theoretically be influenced, but sometimes not in practice, are nevertheless systematic influences.
Take payload as an example. Often you will not be able to load the vehicle as much as you would like. Nevertheless, you theoretically have an influence on the payload.
Random means: No influence at all.
Take the wind as an example, you really can’t influence it in any way.
This distinction is very important, because the procedure, that I will describe in a moment, only works in the case of really purely random influences.
Chance really needs to be able to do its job.
How does fleet monitoring eliminate the random influencing factors?
In fleet monitoring, we use the chance to rule out chance.
Statistics provide the theory. I will go into detail on this in another article. Here is a short summary.
Think of it like this:
If you drive many, many kilometers over many, many years, then on average you will probably climb as many mountains as you descend, you will probably drive in cold temperatures as much as in warm temperatures. And so on and so on ……
Saying this, I talk about probabilities. The area of statistics, therefore, provides the scientific background.
I call the “fleet monitoring” method a “large quantity method”. You need a lot of data for the method to work.
If you really would have an infinite amount of data, the random influencing factors would really be completely averaged out. But that will not be the case, you will always only have a limited number of readings.
This raises the question of whether the number and quality of the input values are sufficient for a precise result.
To be able to judge this, the math gives you the scatter value at hand. The scatter shows you how narrowly or widely the individual values scatter around the average value.
The smaller the scatter, the more you can trust the value.
You will find the calculation of the scatter in the article, which explains the calculation of the average value.
If you choose to use my Excel Template, it will calculate the scatter for you.
With the help of dispersion (mathematically known as “standard deviation”), the confidence interval can be calculated. It is the range around the mean in which the unknown, true consumption value is located with a probability of 95%.
If the average of two groups falls within the confidence interval of the other value, then you must assume that there are no reliable consumption differences. But more on that in the article on normal distribution.
To summarize again, how fleet management deals with random influences:
The use of a lot of input data leads to an averaging of the random influencing factors and thus to a low scattering of the fuel consumption value.
What are systematic influencing factors?
Systematic influencing factors have a reproducible (repeatable) influence on fuel consumption. In principle, they can be influenced.
Since these factors can be influenced, at least in principle, they offer the potential for deliberately influencing fuel consumption.
That is why they are extremely interesting and exactly what we are actually looking for.
Of course, not everyone can influence everything. There are factors that lie within the vehicle manufacturer’s sphere of influence, while others lie with the driver or entrepreneur.
Here are some examples of systematic influencing factors:
- Drive train efficiency of the vehicle
- Payload
- Curb weight of the vehicle
- Aerodynamics of the vehicle
- Rolling resistance of the tires
- Resistance from the trailer
- Driving style of the driver
- Idle time
- Stand still consumption
- Fuel consumption of auxiliaries
- Air conditioning fuel consumption
- Energy consumption of electrical consumers
Again, I’d love to hear from you about what other factors come into your mind.
How are the systematic influencing factors taken into account?
While we ignore the random consumption factors, we have to be very meticulous about the systematic factors!
You must find a way to correlate the effect of these circumstances with the consumption values.
- Was it in winter, spring, summer, or fall?
- What was the average load?
- What was the tread depth of the tires?
- What was the tire pressure?
- and so on ……
The more sorted you document this information, the better you can draw conclusions.
It then goes like this:
The trick is sorting it all out.
You need to spend some time on this task, even if you use fleet management software.
You should schedule it!
There will always be systematic factors that can be influenced in principle, but which cannot be changed in your specific case.
Likewise, there will also be systematic factors that do not have a strong impact.
The more other influencing factors you document, the more options you have to carry out different evaluations.
How can you document the systematic influencing factors?
The classic method is the logbook. Vehicle, date, fuel quantity, and mileage are included as a minimum.
Another possibility is a spreadsheet in Microsoft Excel, Google Docs, or Mac Numbers. You can create these yourself according to your needs.
Fleet Management – IT systems help record such data comprehensively.
In the future, artificial intelligence will assist us in recognizing patterns and provide us with accurate conclusions.
Unfortunately, for now, we still have to do this manually, which is a lot of work.
I’m somewhat surprised that fleet management systems aren’t more advanced in this regard.
Dear Fleet Management Software Providers, feel free to reach out to me if you’re seeking inspiration; I’m happy to help!
But back to the manual method.
Who is fleet monitoring suitable for?
Fleet Monitoring requires a large amount of individual fuel consumption values. Therefore, this method is suitable for drivers and entrepreneurs.
You can do fleet monitoring with multiple vehicles or just with a single vehicle. By sorting the data differently, you can carry out different evaluations with the same data and thus examine several optimization approaches at the same time.
With the method, you can examine the effect of measures in your very specific operations. No other method can do this in this quality.
I consider this method indispensable for entrepreneurs, but I also recommend them to all drivers.
Vehicle manufacturers and magazines often do not have the necessary database and the required time. They, therefore, use alternative methods.
You can tell by the fact that they team up with entrepreneurs when they want to take advantage of the realism of this process. An example is the Fehrenkötter test.
What requirements must be met in order to be able to carry out fleet monitoring?
Conclusion
I wish you every success in using fleet monitoring.
Please let me know, how it works for you. Be sure to take a look at the other articles in the fleet monitoring category to really get all the information on the topic.
Yes, and if it seems a bit complicated to you and you need assistance in using it, just reach out to me.